
Sub-tasks, Parent Tasks and Phases in a SharePoint Gantt Chart
Rolling this out to more teams?
Let our team set up project tracking in SharePoint
We design your project sites, lists, and Power Automate workflows, then train your team so project tracking actually sticks.
A flat list of 200 tasks is a spreadsheet with extra steps. Structure is what makes a project plan readable on a SharePoint page, and Smart Gantt Chart offers two different tools for it — which people routinely confuse.
Phases: grouping, without hierarchy
Every task has a Phase field. Fill it in with something like Discovery, Build, Test or Rollout and you can color the timeline by phase, filter to one phase, and give a status meeting a natural agenda. A phase is a label, not a container: it does not nest anything and it has no dates of its own.
Phases are the lighter-touch option, and for most plans they are enough. See milestones and phases for how they pair with milestone markers.
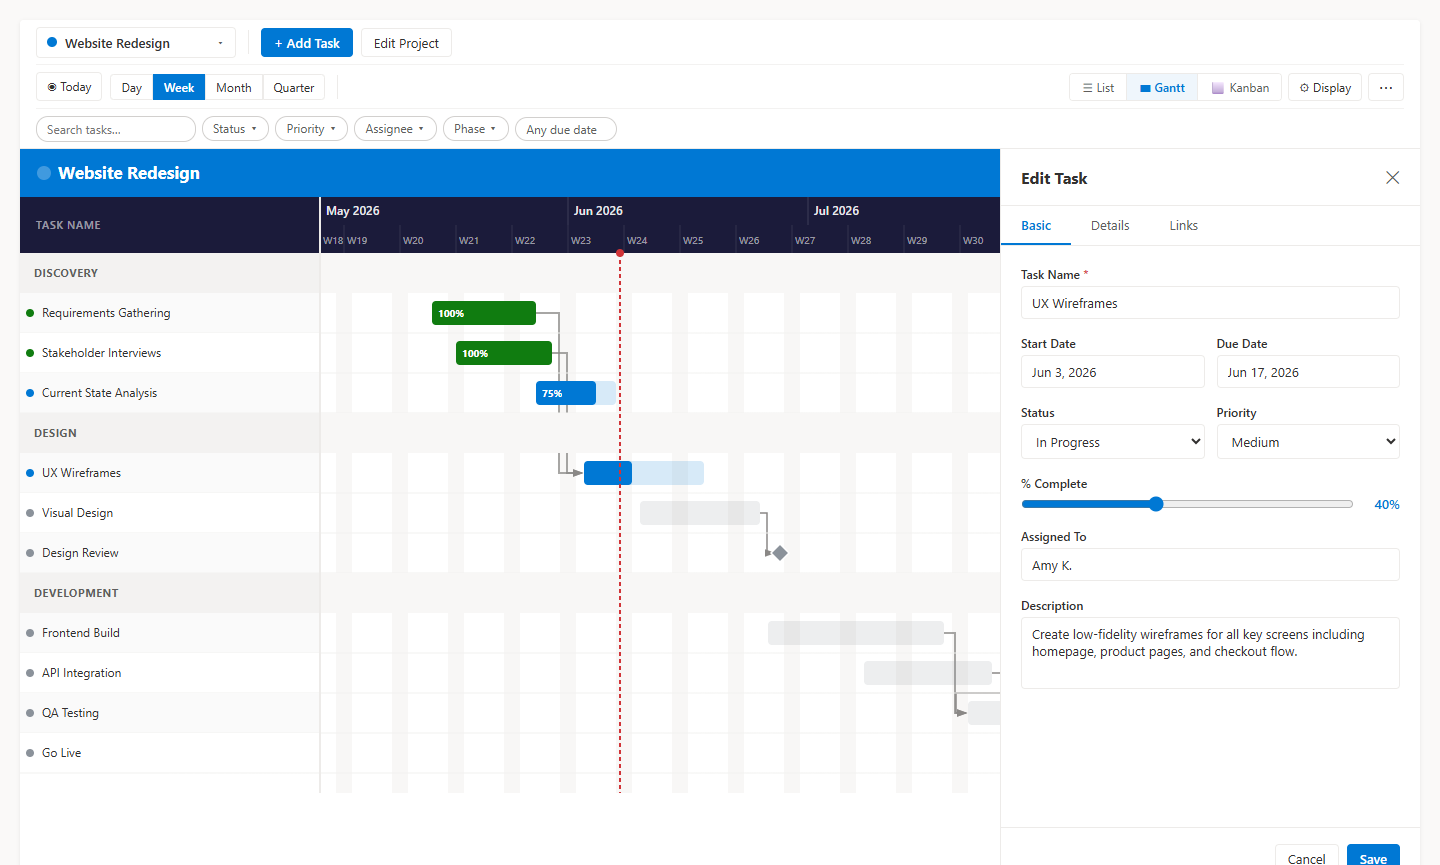
Parent tasks: real hierarchy
Set the Parent Task field on a task and it becomes a sub-task, nested under its parent in the list and the timeline. That is what you want when a single deliverable genuinely decomposes — "Migrate finance site" with six sub-tasks under it — because the parent then reads as one line when nobody needs the detail.
- Create the parent task first, with a start and due date covering the whole deliverable.
- Create each sub-task and pick the parent in the Parent Task field.
- Give every sub-task its own dates, owner and percent complete.
- Keep the hierarchy shallow — two levels is almost always enough.
The roll-up behavior to plan around
This is the part that catches people out: parent bars do not recalculate from their children. Smart Gantt Chart has no summary-task roll-up, so if a sub-task slips three weeks past the parent's due date, the parent bar stays where you put it. Treat the parent span as a commitment you maintain, and check it in the weekly review.
The upside of that simplicity is that nothing moves behind your back. Dependencies behave the same way — the arrows between tasks are informational and never reschedule dates, as covered in task dependencies.
Keeping a structured plan readable
- Color by phase to make the shape of the project obvious at a glance.
- Use compact row density once the plan passes about 60 tasks.
- Filter rather than scroll — see filtering a large plan.
- Mark the dates people care about as milestones so they survive the zoom-out.
Smart Gantt Chart is a free, open-source SPFx web part that runs inside your own tenant — install it from the Smart Gantt Chart page.
Frequently asked questions
What is the difference between a phase and a parent task?
A phase is a grouping label applied to any number of tasks, useful for coloring and filtering the timeline. A parent task is an actual task with sub-tasks nested under it in the hierarchy.
Do parent task dates update automatically from sub-tasks?
No. Smart Gantt Chart does not roll up summary tasks. A parent keeps its own start and due dates, so you update them yourself when the sub-tasks move.
How deep can the hierarchy go?
Assign a task a Parent Task to nest it. Keep the structure shallow — two levels plus phases is usually enough to keep a plan readable on a SharePoint page.
Can I filter the timeline by phase?
Yes. Phases work with the filter bar and with color-by-phase in display settings, which is the quickest way to cut a long plan down for one conversation.
The SharePoint project management guides
Build the plan, run it week to week, then share it with the people who only ever see the summary.
Build the plan
Start a project, add tasks with dates, and get a timeline on a SharePoint page.
Bring a task list, Excel sheet or Microsoft Planner board in through the import wizard.
Group work into phases and mark the dates that people actually care about.
The SharePoint lists the web part creates, who needs which permission, and what that means for governance.
Export a proven plan to Excel, reset the dates, and start every similar project from it.
Run the project
A 20-minute routine straight from the SharePoint page, ending with a one-click deck.
On Track, At Risk, Overdue or Done, derived from dates and progress instead of typed in.
Assign tasks, filter by assignee, and find the person carrying too much of the plan.
Cut a 400-task timeline down to the slice you need for a single conversation.
Retire completed work without losing the record, and recover a project deleted by mistake.
The Portfolio view: a status card per project with automatic health and a mini timeline.
Save the agreed dates, then see each task's finish variance in working days.
How simultaneous edits are protected, and the quick edits that save instantly.
Share and compare
What clients and contractors can do in the plan, and the two things an internal owner handles.
Turn the live plan into a steering-committee deck, plus Excel and PNG output.
Where Calendar and Board views stop, and when dependencies and baselines make a Gantt worth it.
Smart Gantt Chart against Microsoft Project, Planner, Smartsheet, Monday and the rest.
The full picture of running projects from SharePoint, in one page.
The free, open-source Gantt web part that runs inside your own tenant.
Was this page helpful?
One click. No form, no email address.
Missing something in SharePoint Smart Gantt Chart? Feature requests and bug reports go straight to the developer on GitHub — no account needed to read, free account to post.
Request a featureRelated tool
SharePoint Smart Gantt Chart
Gantt + Kanban + list view, backed by a SharePoint list. Free, MIT licensed, no sign-up.
Keep reading
SharePoint Gantt Chart with JSON Formatting: What Works, the Limits, and a Free Alternative
JSON formatting can fake a Gantt bar in a SharePoint list. Here is exactly how far it goes, where it breaks, and the free no-code alternative.
Set a Project Baseline in a SharePoint Gantt Chart (and Track Slippage)
Freeze the agreed dates, then let the Gantt show how far every task has drifted, in working days, right on the SharePoint page.
Several People Editing One SharePoint Project Plan: How Conflicts Are Handled
A shared plan only works if one person's edit never silently wipes out another's. How Smart Gantt Chart handles simultaneous edits, and the fastest ways to update tasks.
Rolling this out to more teams?
Let our team set up project tracking in SharePoint
We design your project sites, lists, and Power Automate workflows, then train your team so project tracking actually sticks.
About the author
Sean Regan
SharePoint & Microsoft 365 consultant with 20+ years of hands-on experience building SPFx web parts, migration tooling and tenant-grade automation. Maintainer of the open-source SharePoint Smart Solutions suite.